
A brief history of data
In this post, we will take a look at how data and analytics platforms and architectures have evolved over the decades and the key factors that influenced those changes.
In 2017, The Economist ran a story titled “The world’s most valuable resource is no longer oil, but data". This was an acknowledgment of the tremendous value that could be unlocked from analyzing the ever-increasing amounts of data being generated. While this article accurately captured the zeitgeist, the concept was not new. Organizations had been gathering insights from data and, as a result, were making data-driven decisions for decades.
So, what (if anything) was special about 2017? How has data and analytics evolved since then? And where is all of this headed in the future? Let's take a quick look at how analytics has changed over time to gain a better understanding of where we are going.
“You can’t really know where you’re going until you know where you have been.”
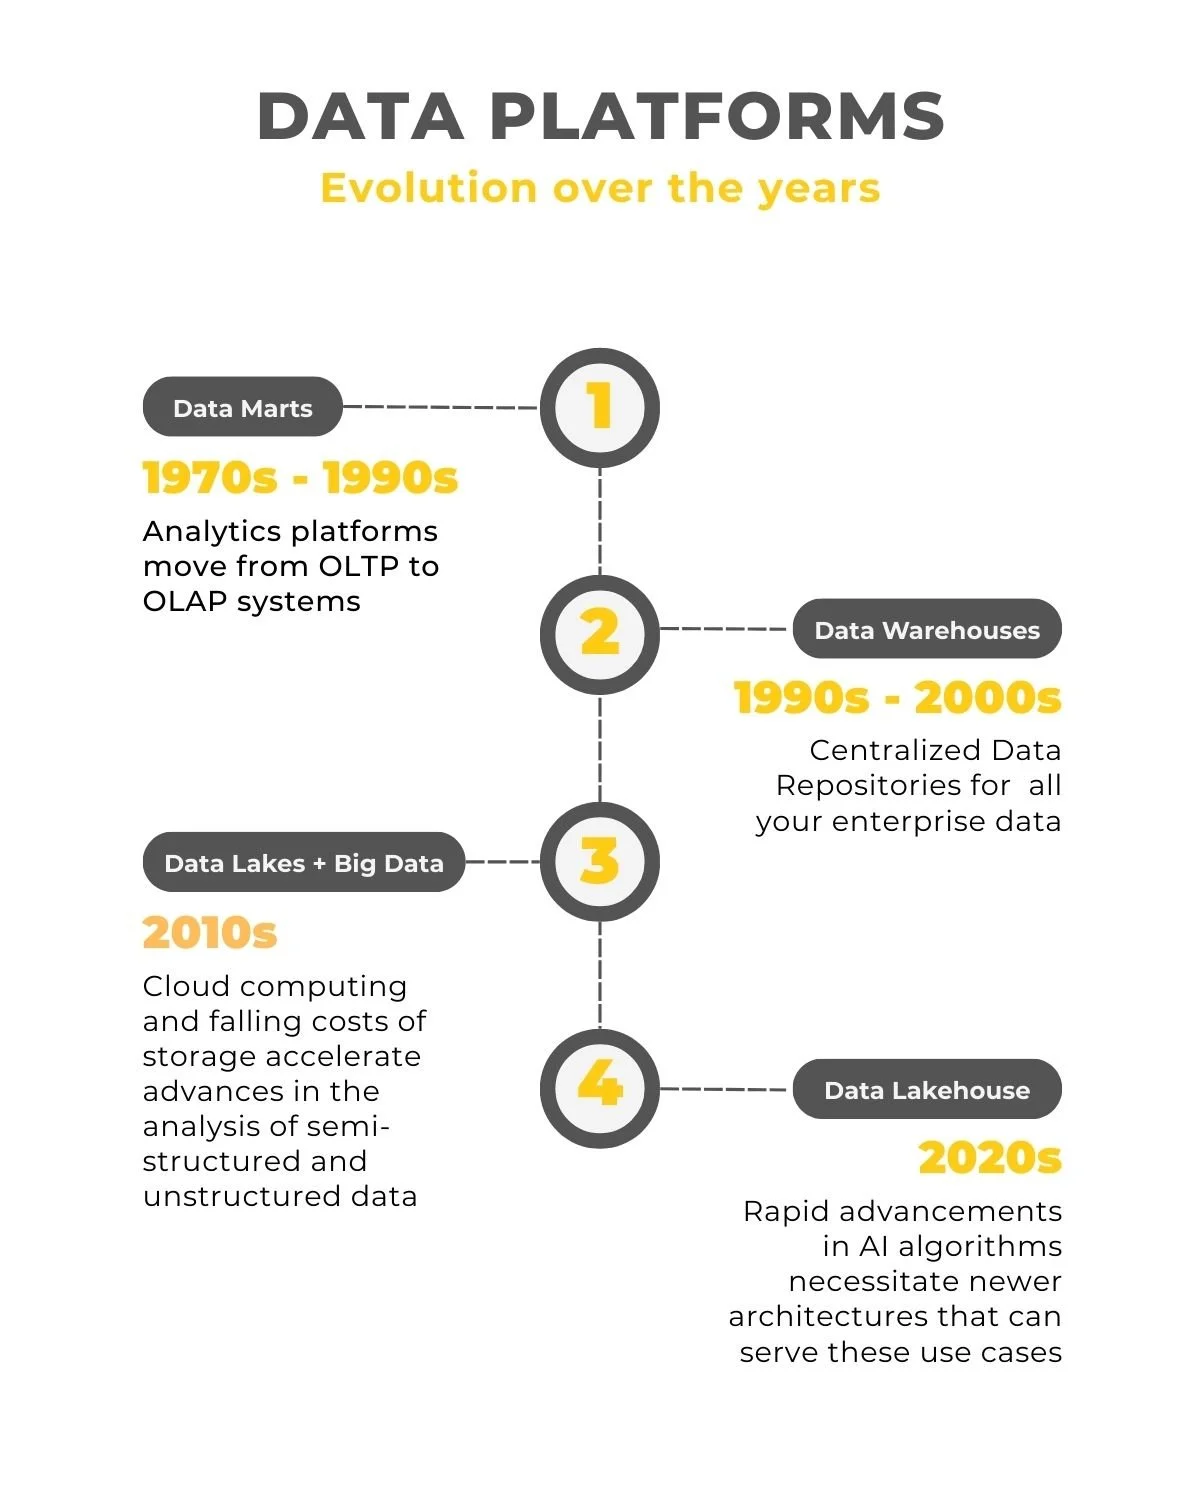
1970s - 1990s | Data Marts and the need for OLAP Engines
In the early days of computing, data was created and stored in transactional database systems. These databases were used as backends to operational systems designed to be able to handle a large volume of read and write transactions efficiently and with low latency. The amount of data handled by these systems per transaction were small (usually a single row). Examples of such systems could be a database that stores the prices of all products and retrieves the price of a single product or a database that tracks the accounts balances of all customers in a bank. These types of workloads are referred to as Online Transaction Processing or OLTP.
In the 70's and 80's, organizations explored the idea of running separate OLTP database instances called data marts which focused on serving specific analytical workloads. So, a large corporation would have say, a sales data mart, a marketing data mart etc.
While this approach was successful for a while, the design choices that made these databases great at OLTP made them less suited for analytical workloads. Analytical workloads have to process large volumes of data to understand historical trends or uncover patterns in the data. This needed a different approach to database design and led to the birth of the Online Analytical Processing (OLAP) engine.
The OLAP databases were designed for bulk data loads (vs the single row writes), handling large volumes of data and predominantly read workloads. Using these types of OLAP database engines opened the floodgates for obtaining insights from data.
1990s - 2000s | The rise and reign of the Enterprise Data Warehouse
While data marts allowed individual departments to get the insights they need (for e.g., sales forecasts), they inadvertently created “data silos" and it was hard for organizations to derive meaningful insights from disparate sources in the organization.
As analytics workloads became more sophisticated, it became evident that there was enormous value in being able to store all your data in a single data store which would be powerful enough to crunch through large amounts of data and provide results in a reasonable amount of time. Enter the Enterprise Data Warehouse (EDW). The EDW powered by newer OLAP engines would allow data from the entire enterprise to be stored in a single location and break down these silos.
Structured Query Language (SQL) became the favored tool for data analysis and modern reporting and visualization tools would gradually replace spreadsheets as the preferred method for publishing insights.
The post Y2K period was a time when the enterprise data warehouse architecture was the widely accepted standard for analytics. This ushered in a new era where the mantra was "More! More! More!". While a year worth of history was sufficient earlier, now data analysts felt they could derive better insights with data from 2, 5 or more years prior. There was a need for lower latency as well. Analysts were no longer willing to wait for days and wanted data to be available overnight or sooner.
The only barrier to growth was cost as the best enterprise data warehouses in the market came with hefty price tag! This was due to the fact that these OLAP databases were sold as "appliances" which had software bundled with customized hardware (storage + compute) and organizations had to often over-provision what they purchased to meet future growth projections. Hardware upgrades were expensive, time consuming and required months of planning and preparation.
© 2025 Insane Insights. All rights reserved.
2010s | Cloud computing, Data Lakes and the fall of the EDW
Two trends in technology from the late 2000s came together to redefine the analytics landscape in the 2010s. The first trend was the sharp decline in the price of storage. You could now store even more of your data for a relatively low cost in your "data lake" and use open-source "big data" tools like Apache Spark to analyze your data. Organizations and developers invested heavily into this idea and over time, you had an entire ecosystem of powerful and capable open-source tools that would go on to shape the analytics landscape of the future. The second trend was the popularization of cloud computing. You no longer needed to buy expensive hardware to run analytics. You could store your data in the cloud (for cheap) and use these new open source tools to load and query your data. Scaling (horizontally or vertically) was a relatively easy task in the cloud and, just like that, analytics had found a new home in the cloud.
With cloud computing, organizations no longer needed to try and solve all analytics on a single platform. They could use purpose-built databases for specific needs. Graph databases, Key value stores and Document stores became core components of a robust data strategy.
Not to be outdone, the data warehouse reinvented itself on the cloud as a modern, scalable version of itself that could access the data stored locally in the data warehouse as well as the data stored externally in the data lake using familiar SQL.
2020s | The age of AI, data lakehouses and interoperability
By the early 2020s, cloud computing had helped make predictive analytics based on machine learning algorithms more accessible and mainstream. This spurred on further innovation since the majority of the data used for machine learning was stored in data lakes. Access to computing resources on the cloud allowed for machine learning algorithms to "learn" and analyze unstructured data like images and text by creating numerical encodings of unstructured data called vectors.
Apache Spark became popular as the tool to analyze the data on the data lake and innovations like open table formats like Apache Iceberg made it possible for ACID transactions. While you could run SQL on your data lake, it was not as performant when compared to the data warehouse.
The need of the hour was a unified solution that would allow data analysts to access their data using SQL and open source tools like Spark with the performance that data analysts had grown accustomed to.
While this is far from solved, the current solution is the adoption of a data lakehouse approach. While there are nuances based on the different solutions available in the market, the goal is to make your data interoperable between different compute engines. Essentially, you could store your data in the data lake or the data warehouse and use SQL/ Spark (or any compute engine of your choice) to analyze your data.
Where do we go from here?
The lakehouse architecture can be seen as true separation of storage and compute and there will be an increased focus on making data stored in different data stores interoperable in the near future
We are in the early days of democratizing vector analytics on unstructured data. You should expect that prepackaged analytics on unstructured data will become more accessible either through the rise of vector databases or through enhanced capabilities built into SQL engines. In any case, you should see vector analytics play a larger part in your overall data ecosystem.
In an age of storage - compute independence, robust data governance and metadata management (both business and technical) will be table stakes. A tremendous amount of resources will be invested in this over the next few years which will shape the analytics of the future. This will fundamentally change how data is managed, consumed and secured.
The data platforms of tomorrow will have to keep up with the pace of innovation in AI algorithms and bring these capabilities to the end user. The evolution of the data platform will continue - We had data marts in the 70s and the data lakehouses in 2025. What will it be in 2030 and beyond?